
boosting survey efficiency with gamification
An unusual and engaging approach we helped UK utility companies to educate their customers while listening to their voices.


An unusual and engaging approach we helped UK utility companies to educate their customers while listening to their voices.
Last year we were fortunate enough to work hand in hand with a few water utility companies in the UK. The basis for our work was a regulation imposed by the UK regulator Ofwat. This collaboration led to some of the most interesting work we have ever done, fusing creativity with digital and behavioural science, and culminating in results that astounded the industry.
Water utility companies within the UK are heavily regulated. If a customer moves to a new city, they do not have the liberty to choose between water providers; they are forced to go with whichever provider is servicing their area. Water utility companies, therefore, enjoy a monopoly in the local market.
However, due to their position, these utilities have to create a business plan every five years that is then submitted to their regulatory authority, Ofwat.

Part of the process states that these utilities must involve their customers in creating their business plan, to ensure that it is not one-sided and that the customers have the opportunity to input their preferences and priorities.
One of Ofwat’s requirements was for water companies to come up with new and innovative approaches when collecting customer feedback. The directive explicitly stated that surveys used must be fun and engaging and, most importantly, they must result in robust data.
The two questions that had to be answered were:
There are many ways one can conduct a survey, so we were brought in by a consultancy to inject some creative technology into the projects.
There were a few challenges we faced:
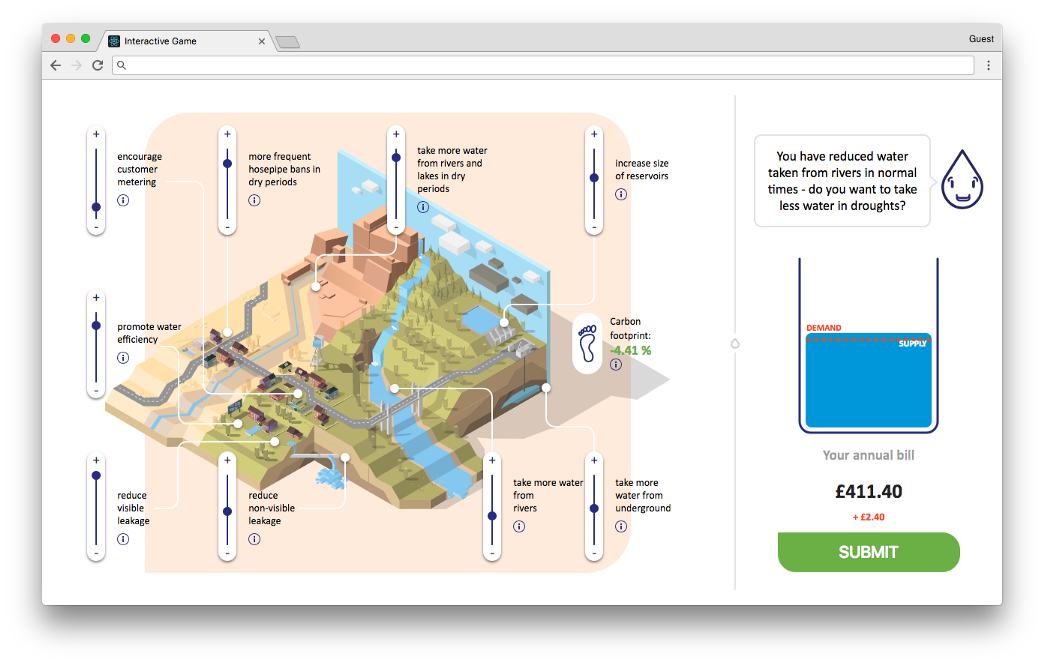
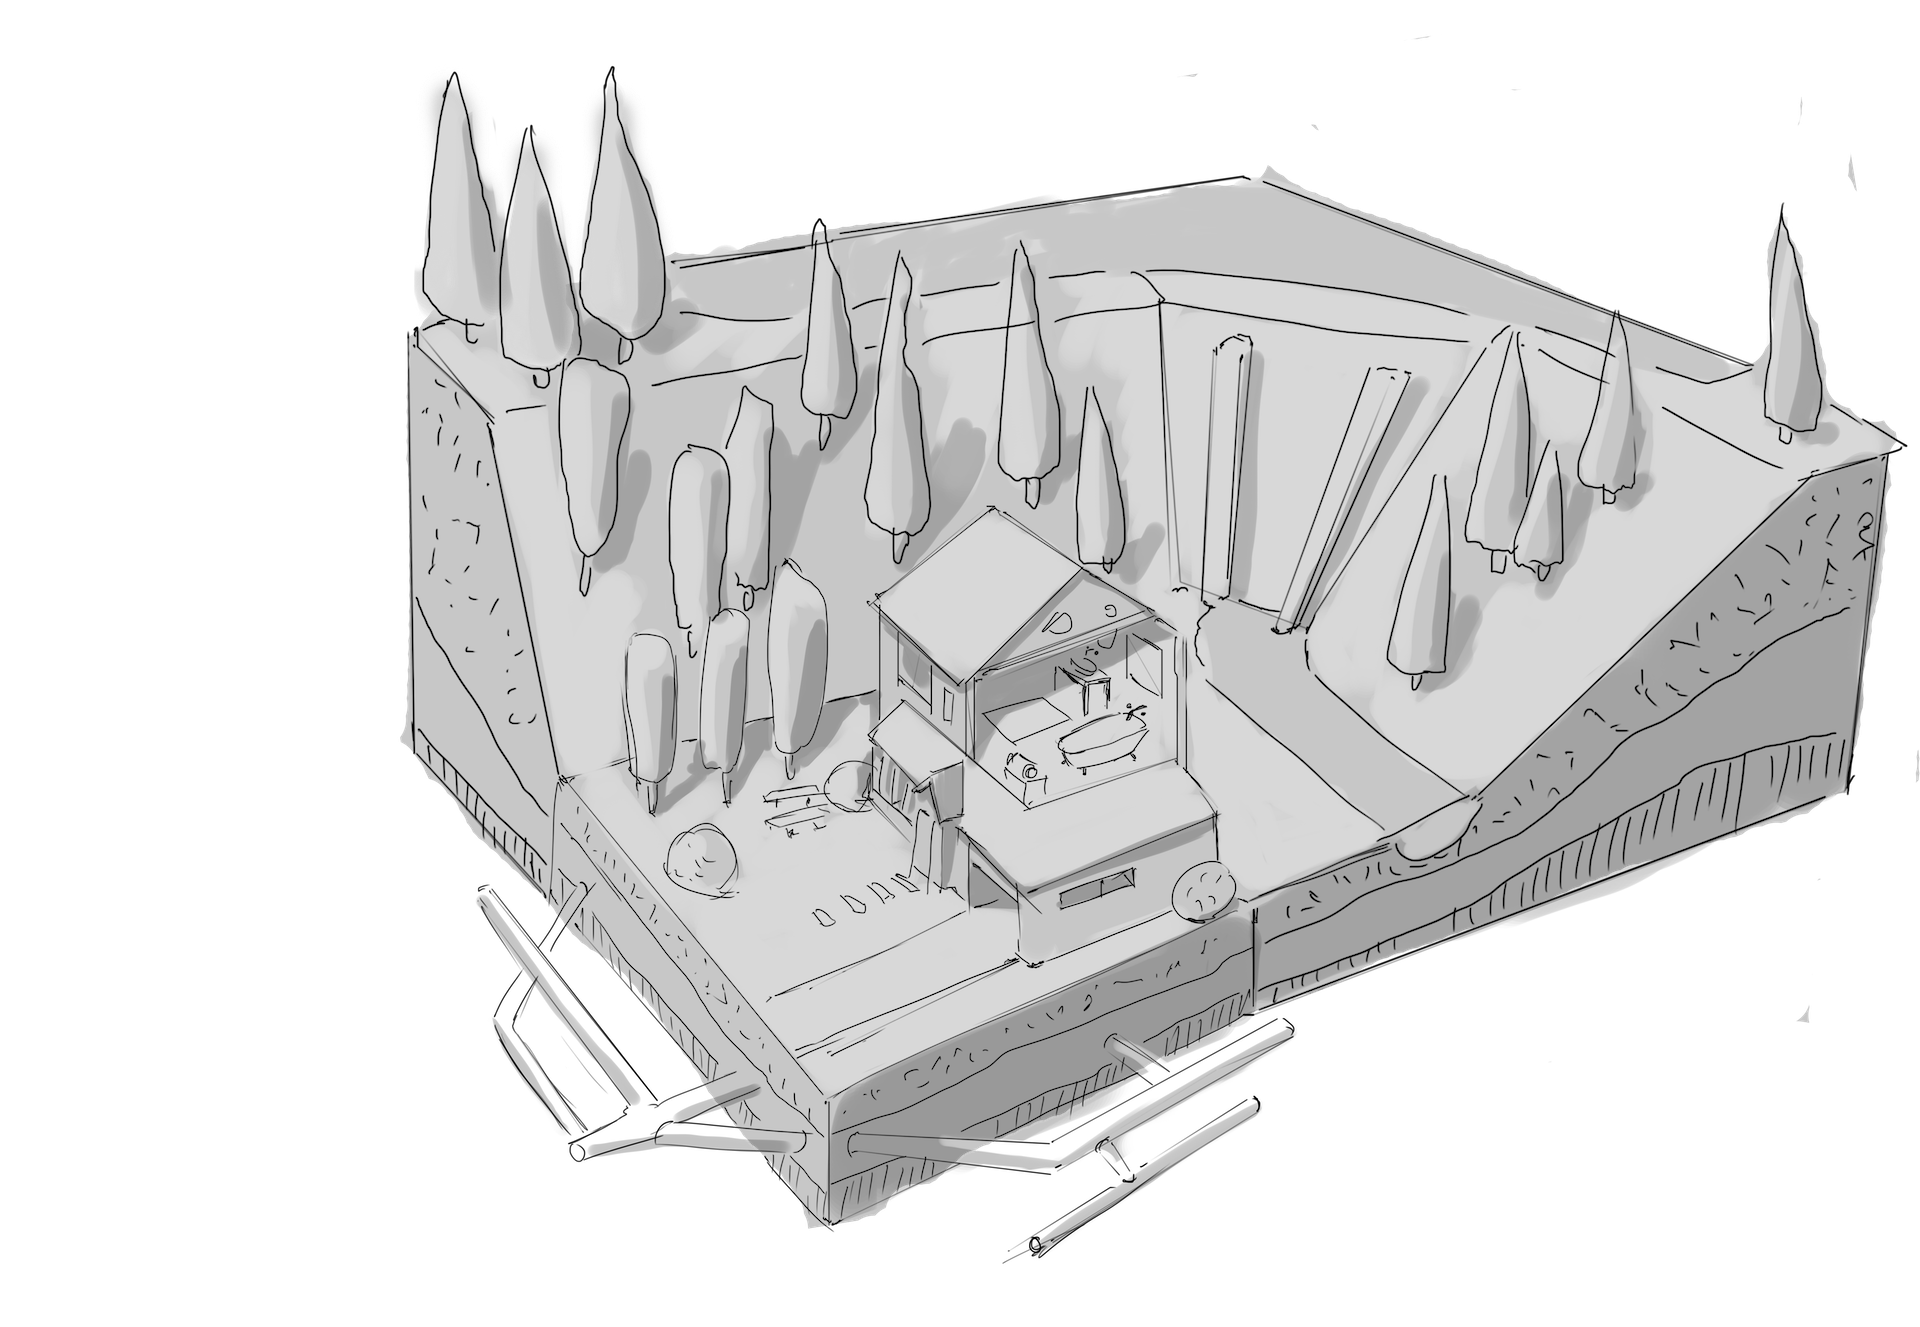
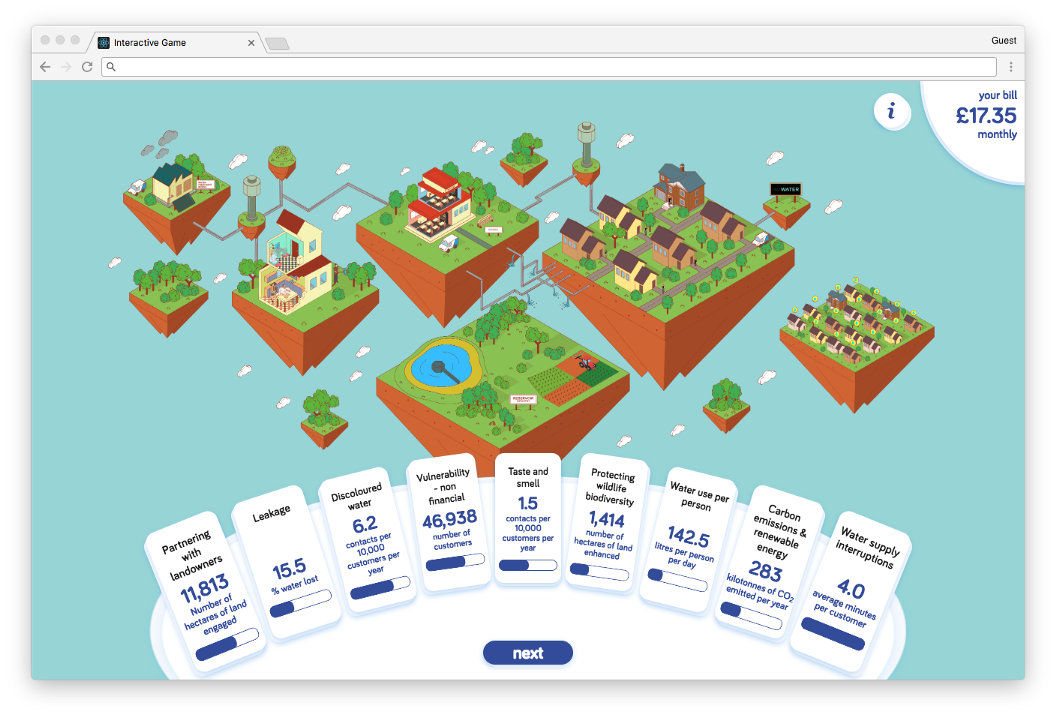
We decided to tackle the lack of context and background by creating a game both educational and fun. The core idea was to create a miniaturised world where we can demonstrate all the different aspects that water utilities must take into account when prioritising.
As users would move the sliders (increasing or decreasing the investment in that service), the world would reflect the change instantly, educating the user of both the pros and cons of their choice within that service level. For example, if users decide to increase the amount of water from the river, it would bring their bills down, but would also have a larger negative impact on the utility’s carbon footprint, as well as the wildlife in and around the river.
This approach also allowed us to include elements of gamification and gratification, so users could see the impact of their choices in real-time, instead of second-guessing and making decisions based on assumptions and limited contexts.

To meet Ofwat’s criteria of making the data robust, we had to take extra care to ensure we were not influencing the users in any way. We had to avoid the so-called framing effect, a cognitive bias that influences the preference of people based on how options are presented to them.
We took these effects into consideration during both our UX and UI design phases, and applied the following two strategies:

We have now worked with multiple water utilities across the UK, applying similar design and psychological principles to different survey concepts, resulting in very different approaches and end products.
However, the overarching and incredibly surprising results from the surveys showed that the majority of the participants opted in for increasing their bills. We surmise this is a direct result of being educated about what it really takes to deliver water to their homes, of being presented the potential negative consequences of their choices; and of the gamification that comes through trying to get the right end price and minimizing negative consequences.
These projects were fun and challenging to work on, but they also reinforced our direction to include behavioural economics at a much deeper level. It is clear that this field has a lot of practical applications to offer in the strategies and designs of digital products.
share this post on